
The Describe Image task in the PTE Speaking section is one of the most predictable and high-scoring question types in the exam. Despite this, many candidates fail to maximize their score because they approach the task without structure or attempt to describe too many unnecessary details. In reality, success in Describe Image depends far more on organization, fluency, and clarity than on complex vocabulary or perfect grammar.
Understanding the Describe Image Task
In the Describe Image task, candidates are given:
- 25 seconds to observe the image and prepare
- Up to 40 seconds to speak
Images may include pie charts, bar graphs, line graphs, tables, maps, or process diagrams. The task assesses a candidate’s ability to identify key information, organize ideas logically, and deliver a fluent spoken response.
Importantly, candidates are not required to describe every figure or data point. Instead, the scoring system rewards relevant content, smooth delivery, and coherent structure.
A High-Band Approach to Describe Image
Focus on the Overall Message
High-scoring responses begin with a clear overview. Identifying the main trend or dominant feature helps the listener immediately understand the image.
Select Key Details Only
Rather than listing all data, select two or three significant points, such as:
- The largest or smallest proportions
- A major comparison
- A noticeable pattern or contrast
This demonstrates analytical ability and prevents hesitation.
Use a Fixed Speaking Structure
Top scorers rely on a consistent template, which ensures:
- Logical flow
- Better fluency
- Reduced exam stress
Recommended High-Scoring Template
A reliable structure for almost all image types is:
The image illustrates [what the image shows].
It is clear that [main trend or comparison].
Looking at the details, [first key feature].
Furthermore, [second important detail or contrast].
Overall, the image provides information about [main topic].
This format allows candidates to speak confidently for 30–35 seconds, which is ideal for maximizing scores.
Example Question
Look at the image below. In 25 seconds, please speak into the microphone and describe in detail what the image is showing. You will have 40 seconds to give your response
Key Points You Should Notice:
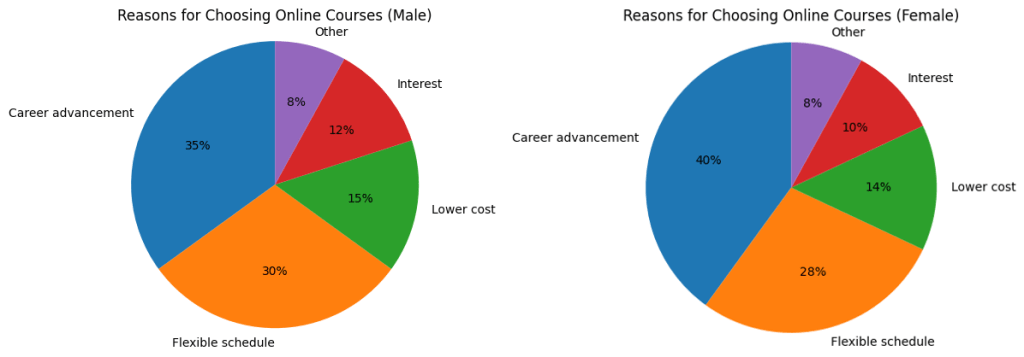
- Career advancement is the main reason for both genders
- Flexible schedule is the second most common reason
- Other reasons make up smaller proportions
Sample PTE Describe Image Answer (High-Scoring)
The image illustrates two pie charts comparing the reasons why males and females choose online courses.
It is clear that career advancement is the most common reason for both groups.
Looking at the details, 35 percent of males and 40 percent of females select online courses to improve their careers.
In addition, flexible schedules are also important, accounting for around 30 percent for males and 28 percent for females.
By contrast, other factors such as cost, personal interest, and miscellaneous reasons represent comparatively smaller proportions.
Overall, the image provides information about key motivations for choosing online education.
Common Errors That Lower Scores
Even strong English speakers often lose marks by:
- Describing every number in the chart because you won’t have much time for that
- Pausing excessively or restarting sentences
- Using memorized, unnatural responses
- Speaking without a clear structure
Avoiding these mistakes is essential for achieving a high band score.

Leave a comment